- Home
- Information Technology
-
Graphics Add-In Board Market

Graphics Add-In Board Market By Type (Discrete, Integrated, Gaming), Application (Content Creation, Design & Visualization, High-performance Computing), End-user (Individual Consumers, Academic & Research, Industrial) & Region - Partner & Customer Ecosystem (Product Services, Proposition & Key Features) Competitive Index & Regional Footprints by MarketDigits - Forecast 2024-2032
Industry : Information Technology | Pages : 168 Pages | Published On : Mar 2024

Graphics Add-in Boards (AIBs) play a crucial role in enhancing graphics performance, enriching gaming encounters, expediting data processing, facilitating professional application support, creating immersive VR/AR experiences, accommodating multi-monitor configurations, ensuring energy efficiency and effective heat control, and enabling customization and upgradability. These benefits establish AIBs as essential elements across numerous industries where superior visual quality and processing power are paramount for achieving favorable outcomes. The Graphics Add-in Board (AIB) market pertains to the sector dedicated to creating, distributing, and selling specialized graphics cards designed for installation onto a computer system's motherboard. AIBs encompass independent graphics processing units (GPUs) that offer enhanced graphics capabilities and performance exceeding the usual offerings of integrated graphics solutions.
The utilization of graphics add-in boards (AIB) has surged due to their application in supercomputers, remote workstations, and simulators. Supercomputers and remote workstations find applications in fields like defense, aerospace, and research and development, driving this demand. With a multitude of countries augmenting their investments in scientific research, the graphic AIB market is poised to experience significant growth throughout the projected period. The prevalence of smartphones, tablets, and laptops is progressively substituting the market for traditional personal computers. The gaming hardware industry is expansive, encompassing a wide range of platforms, including handheld devices, tablets, smartphones, PCs, consoles, and even location-based arcade and gaming establishments. The evolution of gaming machines has transitioned from robust arcade machines located in arcades, eateries, and bars to personal in-home devices like dedicated gaming consoles and microcomputers, and subsequently to PCs. Consequently, the increasing demand for gaming services on smartphones, tablets, and laptops is anticipated to reduce the need for gaming services on monitor-based devices like personal computers. This shift is expected to consequently lessen the demand for graphic AIBs, primarily employed in desktop computers.
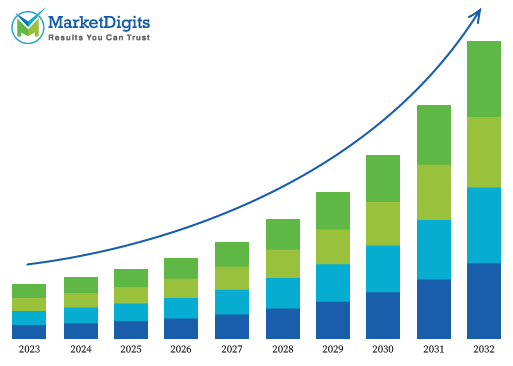
Graphics Add-In Board Market Size
| Report | Details |
|---|---|
| Market Size Value | USD 18.4 billion in 2024 |
| Market Size Value | USD 77.0 billion by 2032 |
| CAGR | 16.40% |
| Forecast Period | 2024-2032 |
| Base Year | 2023 |
| Historic Data | 2020 |
| Segments Covered | Type, Application and End-user |
| Geographics Covered | North America, Latin America, Europe, Asia-Pacific, Middle East & Africa |
Major players in the Graphics Add-In Board Market include Advanced Micro Devices Inc., AsusTek Computer Inc., EVGA Corporation, Gigabyte Technology Co. Ltd., Intel Corporation, Matrox, Micro-Star International Co.(MSI), Nvidia Corporation, Sapphire Technology, ZOTAC (PC Partner Limited), ASUS, PNY Technologies, Palit Microsystems, Inno3D, Gainward, and Others.

Increasing demand for high-quality visual experiences in various applications
A fundamental driver fueling the expansion of the Graphics Add-In Board (AIB) market is the surging desire for superior visual encounters across diverse applications like gaming, content generation, virtual reality, artificial intelligence, and scientific simulations. This surge in demand accentuates the requirement for increasingly potent graphics processing units (GPUs) capable of furnishing elevated graphics quality, refined rendering, and accelerated data processing capabilities. As various industries persist in their dependence on visual computing and advanced graphical functionalities, the Graphics AIB market maintains its robust growth trajectory, primarily steered by the priority placed on superior visual performance.
Rapid integration of artificial intelligence (AI) technologies
A significant movement in the Graphics Add-In Board (AIB) market is the swift incorporation of artificial intelligence (AI) technologies to elevate graphics performance and introduce novel functionalities. This trend encompasses harnessing AI for functions such as instantaneous ray tracing, image enhancement, and optimizations based on deep learning techniques. Through the integration of AI-powered functionalities into graphics cards, manufacturers are facilitating enhanced visual precision, streamlined rendering, and even more intelligent content generation. This convergence of AI and graphics processing is reforming the AIB environment, facilitating heightened immersion and superior performance across diverse applications.
Dominating Region and Country:
In 2022, Asia Pacific dominates Global Graphics Add-In Board Market. The expansion of the consumer electronics sector, coupled with swift advancements in the information technology (IT) service industries within emerging nations such as China, India, South Korea, and Taiwan, is propelling the surge of the graphics add-in board market within the region. Furthermore, the Asia-Pacific region is poised to witness the most rapid growth in the graphics add-in board market throughout the projected timeframe, owing to its substantial consumer base and the burgeoning IT service sector within developing nations. As the adoption of Internet of Things (IoT) devices, which accumulate extensive data requiring monitoring and analysis, continues to rise, the automotive industry in the Asia-Pacific Region has notably elevated its demand for high-performance computing systems.
As for upcoming regions, North America stands as the second-largest region within the Graphics Add-in Board (AIB) market. The robust economies of the United States and Canada, characterized by strong consumer purchasing power, foster a robust demand for sophisticated technologies, including graphics cards tailored for gaming, content creation, and professional applications. This region hosts several prominent technology enterprises and research institutions, consistently driving technological innovation and progress in graphics processing. As a result, there's a heightened need for state-of-the-art AIBs. The region's well-established e-commerce network and widespread availability of technology products streamline consumer access to and acquisition of AIBs. Additionally, North America's investment in technology infrastructure and the increasing integration of emerging technologies contribute significantly to the AIB market's expansion.
The Graphics Add-In Board Market research report provides an in-depth overview of the industry including market segmentation by Type, Application and End-user, and Region. Analysis of the global market with a special focus on high-growth applications in each vertical and fast-growing market segment. It includes a detailed competitive landscape with identification of the key players concerning each type of market, in-depth market share analysis with individual revenue, market shares, and top players’ rankings. Impact analysis of the market dynamics with factors currently driving and restraining the growth of the market, along with their impact in the short, medium, and long-term landscapes. Competitive intelligence from the company profiles, key player strategies, and game-changing developments such as new product launches, collaborations, expansions, investment analysis, mergers, and acquisitions. The market analysis focuses on revenue and forecast by region/countries and by application in terms of revenue forecast for the period 2023-2030.
The report further studies the market strategies of key players, recent development status, plans, and Graphics Add-In Board Market trends across the world. Also, it splits the market segmentation further to deep dive into research and reveals company profile and prospects.

Major Classifications are as follows:
- By Type
- Discrete GPUs
- Integrated GPUs
- Professional GPUs
- Gaming GPUs
- By Application
- Gaming
- Content Creation
- Design and Visualization
- High-performance Computing
- Data Center
- Others
- By End-user
- Individual Consumers
- Enterprise
- Academic & Research Institutions
- Industrial
- Automotive
- Healthcare
- Others
- By Region
- North America
- US
- Canada
- Latin America
- Brazil
- Mexico
- Argentina
- Rest of Latin America
- Europe
- UK
- Germany
- France
- Italy
- Spain
- Russia
- Rest of Europe
- Asia Pacific
- China
- Japan
- India
- South Korea
- Rest of Asia Pacific
- Rest of the World
- Middle East
- UAE
- Saudi Arabia
- Israel
- Rest of the Middle East
- Africa
- South Africa
- Rest of the Middle East & Africa
- Middle East
- North America
Reason to purchase this Graphics Add-In Board Market Report:
- Determine prospective investment areas based on a detailed trend analysis of the global Graphics Add-In Board Market over the next years.
- Gain an in-depth understanding of the underlying factors driving demand for different Graphics Add-In Board Market segments in the top spending countries across the world and identify the opportunities each offers.
- Strengthen your understanding of the market in terms of demand drivers, industry trends, and the latest technological developments, among others.
- Identify the major channels that are driving the global Graphics Add-In Board Market, providing a clear picture of future opportunities that can be tapped, resulting in revenue expansion.
- Channelize resources by focusing on the ongoing programs that are being undertaken by the different countries within the global Graphics Add-In Board Market.
- Make correct business decisions based on a thorough analysis of the total competitive landscape of the sector with detailed profiles of the top Graphics Add-In Board Market providers worldwide, including information about their products, alliances, recent contract wins, and financial analysis wherever available.
TOC
- Executive Summary
- Introduction
- Key Takeaways
- Report Description
- Market Scope & Definition
- Stakeholders
- Research Methodology
-
- Market size
- Key data points from primary sources
- Key data points from secondary sources
- List of primary sources
- List of secondary sources
-
- Market Overview
- Introduction
- Industry Segmentation
- Market Trends Analysis
- Major Funding & Investments
- Market Dynamics
- Drivers
- Restraints
- Opportunities
- Value Chain Analysis
- Graphics Add-In Board Market, By Type
- Discrete GPUs
- Integrated GPUs
- Professional GPUs
- Gaming GPUs
- Graphics Add-In Board Market, By Application
- Gaming
- Content Creation
- Design and Visualization
- High-performance Computing
- Data Center
- Others
- Graphics Add-In Board Market, By End-user
- Individual Consumers
- Enterprise
- Academic & Research Institutions
- Industrial
- Automotive
- Healthcare
- Others
- Graphics Add-In Board Market, By Geography
- North America
- U.S.
- Canada
- Latin America
- Brazil
- Mexico
- Argentina
- Rest of Latin America
- Europe
- UK
- Germany
- France
- Italy
- Spain
- Russia
- Rest of Europe
- Asia Pacific
- China
- Japan
- India
- South Korea
- Rest of Asia Pacific
- Rest of the world (RoW)
- Middle East
- UAE
- Saudi Arabia
- Israel
- Africa
- South Africa
- Rest of Africa
- Middle East
- North America
- Competitive Landscapes
- Introduction
- Top Companies Ranking
- Market Share Analysis
- Competition Dashboard
- Market Share Analysis (2022)
- Emerging company case studies
- Company Profiles
- Advanced Micro Devices Inc.
- Business Overview
- Product Portfolio
- Market Segments (Business Segment/Region)
- Sales Footprint
- Recent Developments
- New Product Launch
- Mergers & Acquisitions
- Collaborations, Partnerships & Agreements
- Rewards & Recognition
- AsusTek Computer Inc.
- Business Overview
- Product Portfolio
- Market Segments (Business Segment/Region)
- Sales Footprint
- Recent Developments
- New Product Launch
- Mergers & Acquisitions
- Collaborations, Partnerships & Agreements
- Rewards & Recognition
- EVGA Corporation
- Business Overview
- Product Portfolio
- Market Segments (Business Segment/Region)
- Sales Footprint
- Recent Developments
- New Product Launch
- Mergers & Acquisitions
- Collaborations, Partnerships & Agreements
- Rewards & Recognition
- Gigabyte Technology Co. Ltd.
- Business Overview
- Product Portfolio
- Market Segments (Business Segment/Region)
- Sales Footprint
- Recent Developments
- New Product Launch
- Mergers & Acquisitions
- Collaborations, Partnerships & Agreements
- Rewards & Recognition
- Intel Corporation
- Business Overview
- Product Portfolio
- Market Segments (Business Segment/Region)
- Sales Footprint
- Recent Developments
- New Product Launch
- Mergers & Acquisitions
- Collaborations, Partnerships & Agreements
- Rewards & Recognition
- Matrox
- Business Overview
- Product Portfolio
- Market Segments (Business Segment/Region)
- Sales Footprint
- Recent Developments
- New Product Launch
- Mergers & Acquisitions
- Collaborations, Partnerships & Agreements
- Rewards & Recognition
- Micro-Star International Co.(MSI)
- Business Overview
- Product Portfolio
- Market Segments (Business Segment/Region)
- Sales Footprint
- Recent Developments
- New Product Launch
- Mergers & Acquisitions
- Collaborations, Partnerships & Agreements
- Rewards & Recognition
- Nvidia Corporation
- Business Overview
- Product Portfolio
- Market Segments (Business Segment/Region)
- Sales Footprint
- Recent Developments
- New Product Launch
- Mergers & Acquisitions
- Collaborations, Partnerships & Agreements
- Rewards & Recognition
- Sapphire Technology
- Business Overview
- Product Portfolio
- Market Segments (Business Segment/Region)
- Sales Footprint
- Recent Developments
- New Product Launch
- Mergers & Acquisitions
- Collaborations, Partnerships & Agreements
- Rewards & Recognition
- ZOTAC (PC Partner Limited)
- Business Overview
- Product Portfolio
- Market Segments (Business Segment/Region)
- Sales Footprint
- Recent Developments
- New Product Launch
- Mergers & Acquisitions
- Collaborations, Partnerships & Agreements
- Rewards & Recognition
- ASUS
- Business Overview
- Product Portfolio
- Market Segments (Business Segment/Region)
- Sales Footprint
- Recent Developments
- New Product Launch
- Mergers & Acquisitions
- Collaborations, Partnerships & Agreements
- Rewards & Recognition
- PNY Technologies
- Business Overview
- Product Portfolio
- Market Segments (Business Segment/Region)
- Sales Footprint
- Recent Developments
- New Product Launch
- Mergers & Acquisitions
- Collaborations, Partnerships & Agreements
- Rewards & Recognition
- Palit Microsystems
- Business Overview
- Product Portfolio
- Market Segments (Business Segment/Region)
- Sales Footprint
- Recent Developments
- New Product Launch
- Mergers & Acquisitions
- Collaborations, Partnerships & Agreements
- Rewards & Recognition
- Inno3D
- Business Overview
- Product Portfolio
- Market Segments (Business Segment/Region)
- Sales Footprint
- Recent Developments
- New Product Launch
- Mergers & Acquisitions
- Collaborations, Partnerships & Agreements
- Rewards & Recognition
- Gainward
- Business Overview
- Product Portfolio
- Market Segments (Business Segment/Region)
- Sales Footprint
- Recent Developments
- New Product Launch
- Mergers & Acquisitions
- Collaborations, Partnerships & Agreements
- Rewards & Recognition
- Advanced Micro Devices Inc.
Table and Figures
Methodology:
At MarketDigits, we take immense pride in our 360° Research Methodology, which serves as the cornerstone of our research process. It represents a rigorous and comprehensive approach that goes beyond traditional methods to provide a holistic understanding of industry dynamics.
This methodology is built upon the integration of all seven research methodologies developed by MarketDigits, a renowned global research and consulting firm. By leveraging the collective strength of these methodologies, we are able to deliver a 360° view of the challenges, trends, and issues impacting your industry.
The first step of our 360° Research Methodology™ involves conducting extensive primary research, which involves gathering first-hand information through interviews, surveys, and interactions with industry experts, key stakeholders, and market participants. This approach enables us to gather valuable insights and perspectives directly from the source.
Secondary research is another crucial component of our methodology. It involves a deep dive into various data sources, including industry reports, market databases, scholarly articles, and regulatory documents. This helps us gather a wide range of information, validate findings, and provide a comprehensive understanding of the industry landscape.
Furthermore, our methodology incorporates technology-based research techniques, such as data mining, text analytics, and predictive modelling, to uncover hidden patterns, correlations, and trends within the data. This data-driven approach enhances the accuracy and reliability of our analysis, enabling us to make informed and actionable recommendations.
In addition, our analysts bring their industry expertise and domain knowledge to bear on the research process. Their deep understanding of market dynamics, emerging trends, and future prospects allows for insightful interpretation of the data and identification of strategic opportunities.
To ensure the highest level of quality and reliability, our research process undergoes rigorous validation and verification. This includes cross-referencing and triangulation of data from multiple sources, as well as peer reviews and expert consultations.
The result of our 360° Research Methodology is a comprehensive and robust research report that empowers you to make well-informed business decisions. It provides a panoramic view of the industry landscape, helping you navigate challenges, seize opportunities, and stay ahead of the competition.
In summary, our 360° Research Methodology is designed to provide you with a deep understanding of your industry by integrating various research techniques, industry expertise, and data-driven analysis. It ensures that every business decision you make is based on a well-triangulated and comprehensive research experience.
• Product Planning Strategy
• New Product Stratergy
• Expanded Research Scope
• Comprehensive Research
• Strategic Consulting
• Provocative and pragmatic
• Accelerate Revenue & Growth
• Evaluate the competitive landscape
• Optimize your partner network
• Analyzing industries
• Mapping trends
• Strategizing growth
• Implementing plans

Covered Key Topics
Growth Opportunities
Market Growth Drivers
Leading Market Players
Company Market Share
Market Size and Growth Rate
Market Trend and Technological
Research Assistance
We will be happy to help you find what you need. Please call us or write to us:
+1 510-730-3200 (USA Number)
Email: sales@marketdigits.com