- Home
- Information Technology
-
Graph Database Market

Graph Database Market by Component (Software & Services), Type of Database (Relational (SQL), Non-Relational (No SQL)) Analysis Type (Connectivity Analysis, Community Analysis, Centrality Analysis) Deployment Mode and Region - Partner & Customer Ecosystem (Product Services, Proposition & Key Features) Competitive Index & Regional Footprints by MarketDigits - Forecast 2024-2032
Industry : Information Technology | Pages : 169 Pages | Published On : Apr 2024

Market Overview
The global Graph Database market has witnessed significant growth in recent years. A graph database is a type of database management system that is designed to store and manage data in the form of a graph. Unlike traditional relational databases, which use tables to represent data and relationships, graph databases leverage nodes, edges, and properties to model and store information. Nodes represent entities, edges denote relationships between entities, and properties store additional information about nodes and edges. Graph databases are designed for handling complex relationships and interconnected data. This makes them valuable for applications such as social networks, fraud detection, recommendation engines, network analysis, and knowledge graphs.
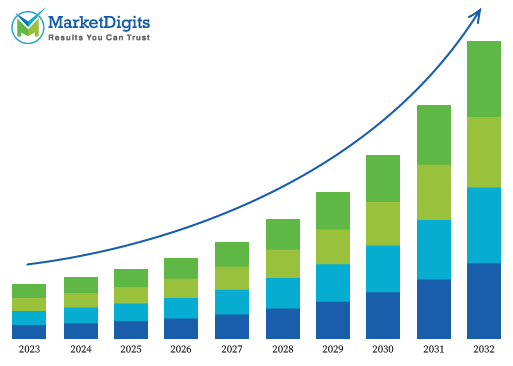
Graph Database Market Size
| Report | Details |
|---|---|
| Market Size Value | USD 2.8 billion in 2024 |
| Market Size Value | USD 14.33 billion by 2032 |
| CAGR | 19.9% |
| Forecast Period | 2024-2032 |
| Base Year | 2023 |
| Historic Data | 2020 |
| Segments Covered | Offering, Component, End User and Region |
| Geographics Covered | North America, Europe, Asia Pacific, and RoW |
Major vendors in the global Graph Database market: Oracle Corporation,IBM Corporation ,Amazon Web Services, Inc., DataStax , Ontotext , Stardog Union , Hewlett Packard Enterprise , ArangoDB , Blazegraph , Microsoft Corporation , SAP SE, Teradata Corporation, Openlink Software, TIBCO Software, Inc., Neo4j, Inc., GraphBase, Cambridge Semantics, TigerGraph, Inc., Objectivity Inc., Bitnine Co, Ltd. , Franz Inc. , Redis Labs , Graph Story ,Dgraph Labs , Eccenca , Flureeand others.
Management & Analysis of complex relationships with datasets
One of the key driving factor behind the growth of the Graph Database market is the increasing need to manage and analyse complex relationships within data sets, common in applications such as social networks, supply chains, and fraud detection, thus driving the market for the graph database management. Graph databases excel in representing and querying interconnected data, making them essential for scenarios where relationships are central to insights.
Also with the growing demand for real-time analytics, especially in industries such as finance, healthcare, and cybersecurity, the adoption of graph databases has surged significantly. Their ability to quickly traverse relationships enables organizations to gain immediate insights, making them invaluable for applications that require timely decision-making and response. Unlike rigidly structured relational databases, graph databases offer a schema-less approach, allowing organizations to easily modify and extend their data models without significant disruptions.
Market Dynamics
Drivers:
- Fraud Detection and Analysis
- Cybersecurity threat detection.
- Semantic data integration.
- Healthcare network analysis & management of complex data relationships.
- Geospatial analysis and event impact analysis.
Opportunities:
- Healthcare Data Interoperability.
- Graph Databases in Quantum Computing.
- Energy Grid Optimization
- Graph-Based Semantic Search Engines & Robotics programming.
- Network and supply chain mapping.
Network & Supply Chain Mapping.
The advanced supply chains are vast and complex structure and are quite vulnerable to disruptions including the component shortages and the transportation delays. Graph databases acts like super-smart organizers for understanding relationships. In network mapping, like when we're dealing with computers, people, or anything connected, graph databases make things much clearer. Imagine you have a bunch of computers in an office, and they're all connected to each other. Each computer is a "node" in the graph, and the connections between them are the "edges." Now, let's say you want to find out which computer is connected to another, or you want to know if there's a weak link in the network. That's where a graph database works perfectly. For instance a shipping company might use a graph database to track the location of its ships and cargo in real-time.
Additionally these databases can be utilized for analyzing network traffic and identify security threats. This can help businesses to protect their networks from cyberattacks. For example, a security company might use a graph database to analyze network traffic to identify malicious activity Moreover a a shipping company might use a graph database to track the location of its ships and cargo in real-time.
North America dominates the market for Graph Database.
North America currently holds the largest share and is poised to maintain its dominance in the graph database market. These are propelled by several key factors that collectively establish the region as a powerhouse for technological innovation and adoption. Also North America's status as a global hub for technological innovation and research, with the United States leading the region. The region hosts a myriad of leading graph database vendors and technology startups, creating a concentrated environment of innovation that propels the development and widespread adoption of advanced technologies, notably graph databases.
The strong presence of tech giants, including industry behemoths like Amazon, Microsoft, and Google, further cements North America's position. These major players offer cloud platforms seamlessly integrated with graph database services, providing businesses with accessible and scalable solutions that facilitate the adoption and implementation of graph databases within their infrastructure.
The diverse applications of graph databases across industries in North America contribute significantly to their dominance. It has its presence right from fraud detection in financial services to supporting complex relationships in patient data within healthcare, the versatility of graph databases positions them as invaluable tools across different sectors.
The Software Segment is anticipated to hold the Largest Market Share during the Forecast Period.
The software segment dominates the market for the global graph database management. It has a wielding substantial influence by providing the essential technological framework for organizations to tap into the potential of graph databases. Serving as the bedrock for the creation, querying, and management of graph-based data structures, graph database software emerges as an indispensable component, empowering businesses to harness the intricate power of relationships within their datasets. This software not only facilitates the creation and management of nodes and edges but also integrates query languages like Cypher for Neo4j, enabling users to deftly retrieve and manipulate data with a distinct focus on relationships.
The software's capacity to augment data relationships and unveil concealed patterns fuels its adoption across industries. The pervasive influence of cloud-based solutions has further shaped the market dynamics, with organizations increasingly favoring cloud-based graph database solutions. This underscores the pivotal role of software in delivering scalable, accessible, and flexible database management solutions. Beyond foundational functionalities, graph database software emerges as a catalyst for innovation, enabling the development of applications endowed with advanced features like real-time analytics, personalized recommendations, and intricate network analysis.
Segmentations Analysis of Graph Database Market: -
- By Component
- Software
- Services
- By Type Of Database
- Relational (SQL)
- Non-Relational (No SQL)
- By Analysis Type
- Connectivity Analysis
- Community Analysis
- Centrality Analysis
- By Deployment Mode
- On Premise
- Cloud Based
- By Region
- North America
- US
- Canada
- Latin America
- Brazil
- Mexico
- Argentina
- Colombia
- Chile
- Peru
- Rest of Latin America
- Europe
- UK
- Germany
- France
- Italy
- Spain
- Russia
- BENELUX
- CIS & Russia
- Nordics
- Austria
- Poland
- Rest of Europe
- Asia Pacific
- China
- Japan
- India
- South Korea
- Thailand
- Indonesia
- Malaysia
- Vietnam
- Australia & New Zealand
- Rest of Asia Pacific
- Middle East & Africa
- Saudi Arabia
- UAE
- South Africa
- Nigeria
- Egypt
- Israel
- Turkey
- Rest of Middle East & Africa
- North America
Recent Developments
- April 2023, Neo4j revealed a strategic collaboration with Imperium Solutions to address the increasing demand for graph technology in Singapore. Through this partnership, Imperium Solutions will play a crucial role in ensuring that customers extract optimal value from Neo4j, the globally recognized leader in graph databases. Neo4j specializes in resolving intricate enterprise-level challenges and adeptly identifies relationships and patterns within extensive datasets.
- May 2023, SAP and Google Cloud unrevealed a substantial expansion of their collaboration, marked by the introduction of a comprehensive open data solution aimed at streamlining data landscapes and harnessing the potential of business data. This innovative offering combines the data and analytics technology of SAP and Google Cloud, enhancing the accessibility and significance of enterprise data while propelling the development of artificial intelligence in the business realm.
Graph Database Market Report Gives Answers to Following Key Questions:
- What will be the Graph Database Market’s Trends & growth rate? What analysis has been done of the prices, sales, and volume of the top producers of Graph Database Market?
- What are the main forces behind the worldwide Graph Database Market? Which companies dominate the Graph Database Market?
- Which companies dominate the Graph Database Market? Which business possibilities, dangers, and tactics did they embrace in the market?
- What are the global Healthcare Assistive Relational (SQL)'s suppliers' opportunities and dangers in Graph Database Market?
- What is the Healthcare Assistive Relational (SQL)'s regional sales, income, and pricing analysis? In the Graph Database Market, who are the distributors, traders, and resellers?
- What are the main geographic areas for various trades that are anticipated to have astounding expansion over the Graph Database Market?
- What are the main geographical areas for various industries that are anticipated to observe an astounding expansion in Graph Database Market?
- What are the dominant revenue-generating regions for Graph Database Market, as well as regional growth trends?
- By the end of the forecast period, what will the market size and growth rate be?
- What are the main Graph Database Market trends that are influencing the market's expansion?
- Which key Component categories dominate the Graph Database Market? What are the Graph Database Market’s main Type Of Databases?
- In the coming years, which Graph Database Market technology will dominate the market?
Reason to purchase this Graph Database Market Report:
- Determine prospective investment areas based on a detailed trend analysis of the global Graph Database Market over the next years.
- Gain an in-depth understanding of the underlying factors driving demand for different Graph Database Market segments in the top spending countries across the world and identify the opportunities each offers.
- Strengthen your understanding of the market in terms of demand drivers, industry trends, and the latest technological developments, among others.
- Identify the major channels that are driving the global Graph Database Market, providing a clear picture of future opportunities that can be tapped, resulting in revenue expansion.
- Channelize resources by focusing on the ongoing programs that are being undertaken by the different countries within the global Graph Database Market.
- Make correct business decisions based on a thorough analysis of the total competitive landscape of the sector with detailed profiles of the top Graph Database Market providers worldwide, including information about their products, alliances, recent contract wins, and financial analysis wherever available.
TOC
Table and Figures
Methodology:
At MarketDigits, we take immense pride in our 360° Research Methodology, which serves as the cornerstone of our research process. It represents a rigorous and comprehensive approach that goes beyond traditional methods to provide a holistic understanding of industry dynamics.
This methodology is built upon the integration of all seven research methodologies developed by MarketDigits, a renowned global research and consulting firm. By leveraging the collective strength of these methodologies, we are able to deliver a 360° view of the challenges, trends, and issues impacting your industry.
The first step of our 360° Research Methodology™ involves conducting extensive primary research, which involves gathering first-hand information through interviews, surveys, and interactions with industry experts, key stakeholders, and market participants. This approach enables us to gather valuable insights and perspectives directly from the source.
Secondary research is another crucial component of our methodology. It involves a deep dive into various data sources, including industry reports, market databases, scholarly articles, and regulatory documents. This helps us gather a wide range of information, validate findings, and provide a comprehensive understanding of the industry landscape.
Furthermore, our methodology incorporates technology-based research techniques, such as data mining, text analytics, and predictive modelling, to uncover hidden patterns, correlations, and trends within the data. This data-driven approach enhances the accuracy and reliability of our analysis, enabling us to make informed and actionable recommendations.
In addition, our analysts bring their industry expertise and domain knowledge to bear on the research process. Their deep understanding of market dynamics, emerging trends, and future prospects allows for insightful interpretation of the data and identification of strategic opportunities.
To ensure the highest level of quality and reliability, our research process undergoes rigorous validation and verification. This includes cross-referencing and triangulation of data from multiple sources, as well as peer reviews and expert consultations.
The result of our 360° Research Methodology is a comprehensive and robust research report that empowers you to make well-informed business decisions. It provides a panoramic view of the industry landscape, helping you navigate challenges, seize opportunities, and stay ahead of the competition.
In summary, our 360° Research Methodology is designed to provide you with a deep understanding of your industry by integrating various research techniques, industry expertise, and data-driven analysis. It ensures that every business decision you make is based on a well-triangulated and comprehensive research experience.
• Product Planning Strategy
• New Product Stratergy
• Expanded Research Scope
• Comprehensive Research
• Strategic Consulting
• Provocative and pragmatic
• Accelerate Revenue & Growth
• Evaluate the competitive landscape
• Optimize your partner network
• Analyzing industries
• Mapping trends
• Strategizing growth
• Implementing plans

Covered Key Topics
Growth Opportunities
Market Growth Drivers
Leading Market Players
Company Market Share
Market Size and Growth Rate
Market Trend and Technological
Research Assistance
We will be happy to help you find what you need. Please call us or write to us:
+1 510-730-3200 (USA Number)
Email: sales@marketdigits.com